In this site's model a 10 kWh battery with 4 kWp of solar on Octopus Flux saves between £379 and £455 a year depending on region, for a home using 3,000 kWh. The gap between the cheap and peak Flux rates ranges from 19.37p to 21.44p per kWh, and a 4 kWp array makes about 3,241 kWh a year in Inverness against 4,624 in Brighton. Region matters, but the tariff you choose matters more.
Every region at a glance
| Region | Electricity regions and network operators | Flux peak minus cheap rate | 10 kWh saving, solar on Flux | 10 kWh saving, no solar on Agile | 4 kWp yield, kWh a year | Homes with solar |
|---|---|---|---|---|---|---|
| London | London UK Power Networks (London Power Networks) | 20.37p | £414 | £335 | 4,075 | 65,504 |
| South East England | South East England, Southern England UK Power Networks (South Eastern Power Networks); SSEN (Southern Electric Power Distribution) | 20.44p to 20.64p | £421 to £435 | £287 to £308 | 4,071 to 4,624 | 253,139 |
| South West England | South West England, Southern England National Grid Electricity Distribution (South West); SSEN (Southern Electric Power Distribution) | 20.43p to 20.44p | £421 to £425 | £250 to £308 | 4,092 to 4,488 | 233,369 |
| East of England | Eastern England UK Power Networks (Eastern Power Networks) | 20.41p | £427 | £307 | 4,126 to 4,302 | 208,901 |
| East Midlands | East Midlands National Grid Electricity Distribution (East Midlands) | 19.37p | £386 | £297 | 3,880 to 4,069 | 157,584 |
| West Midlands | West Midlands, East Midlands National Grid Electricity Distribution (West Midlands); National Grid Electricity Distribution (East Midlands) | 19.37p to 19.55p | £386 to £390 | £276 to £297 | 3,703 to 4,002 | 135,712 |
| Yorkshire and the Humber | Yorkshire, North East England Northern Powergrid (Yorkshire); Northern Powergrid (Northeast) | 19.48p to 19.52p | £379 to £385 | £272 to £303 | 3,739 to 3,958 | 139,449 |
| North West England | North West England, Merseyside and North Wales SP Electricity North West; SP Energy Networks (SP Manweb) | 20.21p to 21.44p | £417 to £455 | £300 to £317 | 3,544 to 3,860 | 158,602 |
| North East England | North East England Northern Powergrid (Northeast) | 19.48p | £385 | £272 | 3,766 to 3,804 | 79,912 |
| Wales | South Wales, Merseyside and North Wales National Grid Electricity Distribution (South Wales); SP Energy Networks (SP Manweb) | 20.37p to 21.44p | £422 to £455 | £277 to £317 | 3,244 to 4,167 | 124,516 |
| Scotland | South Scotland, North Scotland SP Energy Networks (SP Distribution); SSEN (Scottish Hydro Electric Power Distribution) | 19.96p to 20.47p | £379 to £407 | £222 to £291 | 3,241 to 3,751 | 149,183 |
Across the eleven regions, DESNZ counts 1,705,871 domestic-scale solar installations at the end of July 2026, every one of them a home that could add a battery to panels it already has.
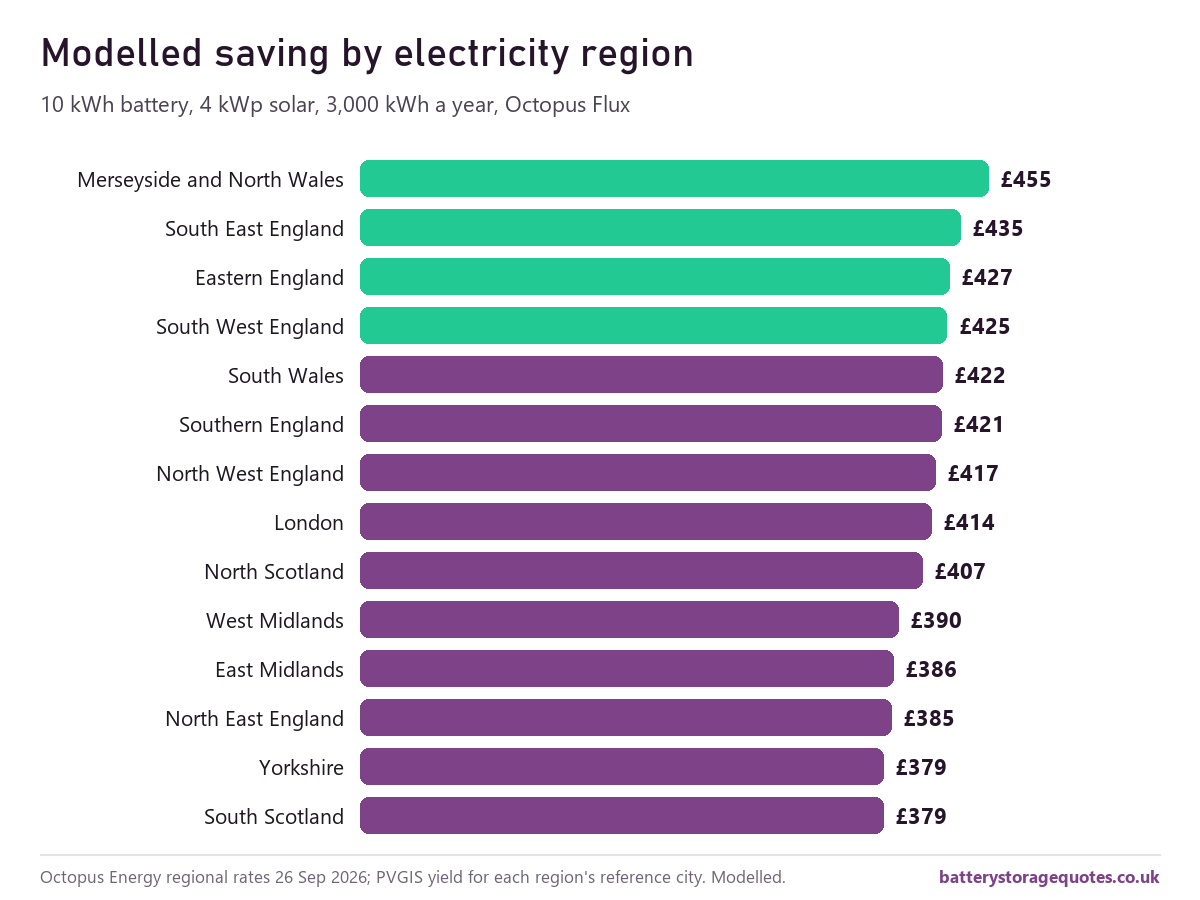
Why the numbers differ
- Tariff rates are set per electricity region. Network charges differ across the 14 regions, so every tariff has 14 sets of prices. On Flux the peak-to-cheap gap is widest in Merseyside and North Wales and narrowest in East Midlands, and a battery's saving follows the gap.
- Solar output falls from south to north. PVGIS puts a 4 kWp array at about 4,624 kWh a year in Brighton and 3,241 in Inverness. Less solar means less surplus to store, especially from November to February.
- Power cuts are more common in some networks. In 2024/25, customers of London's network lost an average of 10.5 minutes of supply, against 68.9 minutes in North Scotland. Where cuts are longer or more frequent, backup is worth more.
- The network operator handles your connection. Each regional page names the distribution network operator and links to its connections page for G98 notifications and G99 applications.
The regional pages
London
Lowest standing charge, most reliable network, but flats and terraces make siting a battery the real challenge.
Rates, solar and networks →South East England
The biggest solar retrofit market, the sunniest yields and a network boundary that splits counties.
Rates, solar and networks →South West England
Strong solar, the most frequent power cuts in England, and why batteries here work best with panels.
Rates, solar and networks →East of England
One network area, strong East Anglian solar and a large base of existing panels to add batteries to.
Rates, solar and networks →East Midlands
Britain's cheapest unit rates, its narrowest time-of-use spread and a reliable network: why that trims battery savings.
Rates, solar and networks →West Midlands
Birmingham's network area, why Coventry is on the East Midlands one, and the standing charge that stands out.
Rates, solar and networks →Yorkshire and the Humber
Frequent power cuts, a high standing charge, modest solar, and why York is on a different network from Leeds.
Rates, solar and networks →North West England
Two networks, Britain's lowest and highest standing charges, and why the dearer Merseyside area suits a battery best.
Rates, solar and networks →North East England
The fewest solar roofs in England, a network above the GB average for cuts, and a battery case led by the tariff.
Rates, solar and networks →Wales
South Wales and North and Mid Wales on different networks, the Manweb price premium, and what Nest does and does not fund.
Rates, solar and networks →Scotland
Weak winter solar, the longest power cuts in the north, no Home Energy Scotland battery funding: a tariff, backup and heat-pump case, with 3 November 2026 rates.
Rates, solar and networks →Northern Ireland
A separate network and regulator, no Smart Export Guarantee, NIE Networks' own connection rules and Power NI's day and night rates. The GB tariff data above does not apply there.
Rules, export and funding →The calculator fills in your regional rates from your postcode. When you want prices, ask for battery storage quotes (we reply by email) and compare them on the same usable capacity.
Questions about regions
Do home battery savings vary by region?
Yes, because tariff rates and solar output both vary. In this site's model a 10 kWh battery with 4 kWp of solar on Octopus Flux saves from £379 a year (South Scotland) to £455 (Merseyside and North Wales) for a home using 3,000 kWh a year. The spread between regions is smaller than the difference between tariffs.
Which part of Great Britain is best for a home battery?
On Octopus Flux with solar, Merseyside and North Wales, which has the widest gap between the cheap and peak rates. Without solar, on Agile Octopus, London comes out highest in the model. For solar yield, the south coast leads: a 4 kWp array in Brighton makes about 4,624 kWh a year in PVGIS, against about 3,241 in Inverness.
How do I find my electricity region?
Your region is the grid supply point area that serves your postcode, which does not always follow county boundaries. The calculator looks it up from your postcode using Octopus Energy's public lookup and fills in your regional rates.
Is Northern Ireland covered?
Not by the regional pages. Northern Ireland has its own electricity market and suppliers, so the tariffs on this site do not apply there. The fire-safety and VAT guidance does.